
The DTC Attribution Map: How to Connect Meta, Google, TikTok Shop, Klaviyo and AI Referrals Into One Margin Dashboard
Key takeaways
- Add up what every platform claims for one month and compare it to Shopify. The gap is your over-claim factor, and it is usually large.
- Run the business on three Shopify-based numbers: MER, new-customer CAC and contribution margin after ad spend.
- Fix Meta CAPI, Google enhanced conversions or server-side tagging, and TikTok Events API before peak season, when weak signals cost the most.
- Treat TikTok Shop and AI referrals as separate channels with their own margin math, since their economics differ from your Shopify store.
- Pay for a third-party attribution tool once spend and channel count make conflicting reports expensive, and still check its numbers against Shopify.
DTC marketing attribution works best when Shopify orders are the source of truth. Track MER, new-customer CAC and contribution margin after ad spend, then reconcile Meta, Google, TikTok Shop, Klaviyo and AI referral claims against Shopify weekly. Fix server-side signals before peak season so each channel's real contribution is visible.
Your platforms are counting the same order more than once
Every ad platform reports a good month. Meta, Google, TikTok and Klaviyo each say they drove strong revenue.
The trouble shows up when you put those reports side by side:
- Add up what each platform claims and the total is higher than what Shopify actually collected.
- None of them knows your cost of goods, shipping or discounts, so none of them reports margin.
- Peak season is coming, which is when weak signals and default settings you never chose cost the most.
What you actually need to know is what each channel adds to your profit.
I answer that with one dashboard that starts with Shopify orders and works outward. It tracks three numbers above everything else: marketing efficiency ratio (MER), new-customer acquisition cost (CAC) and contribution margin after ad spend. Every platform's claims then get reconciled against Shopify each week.
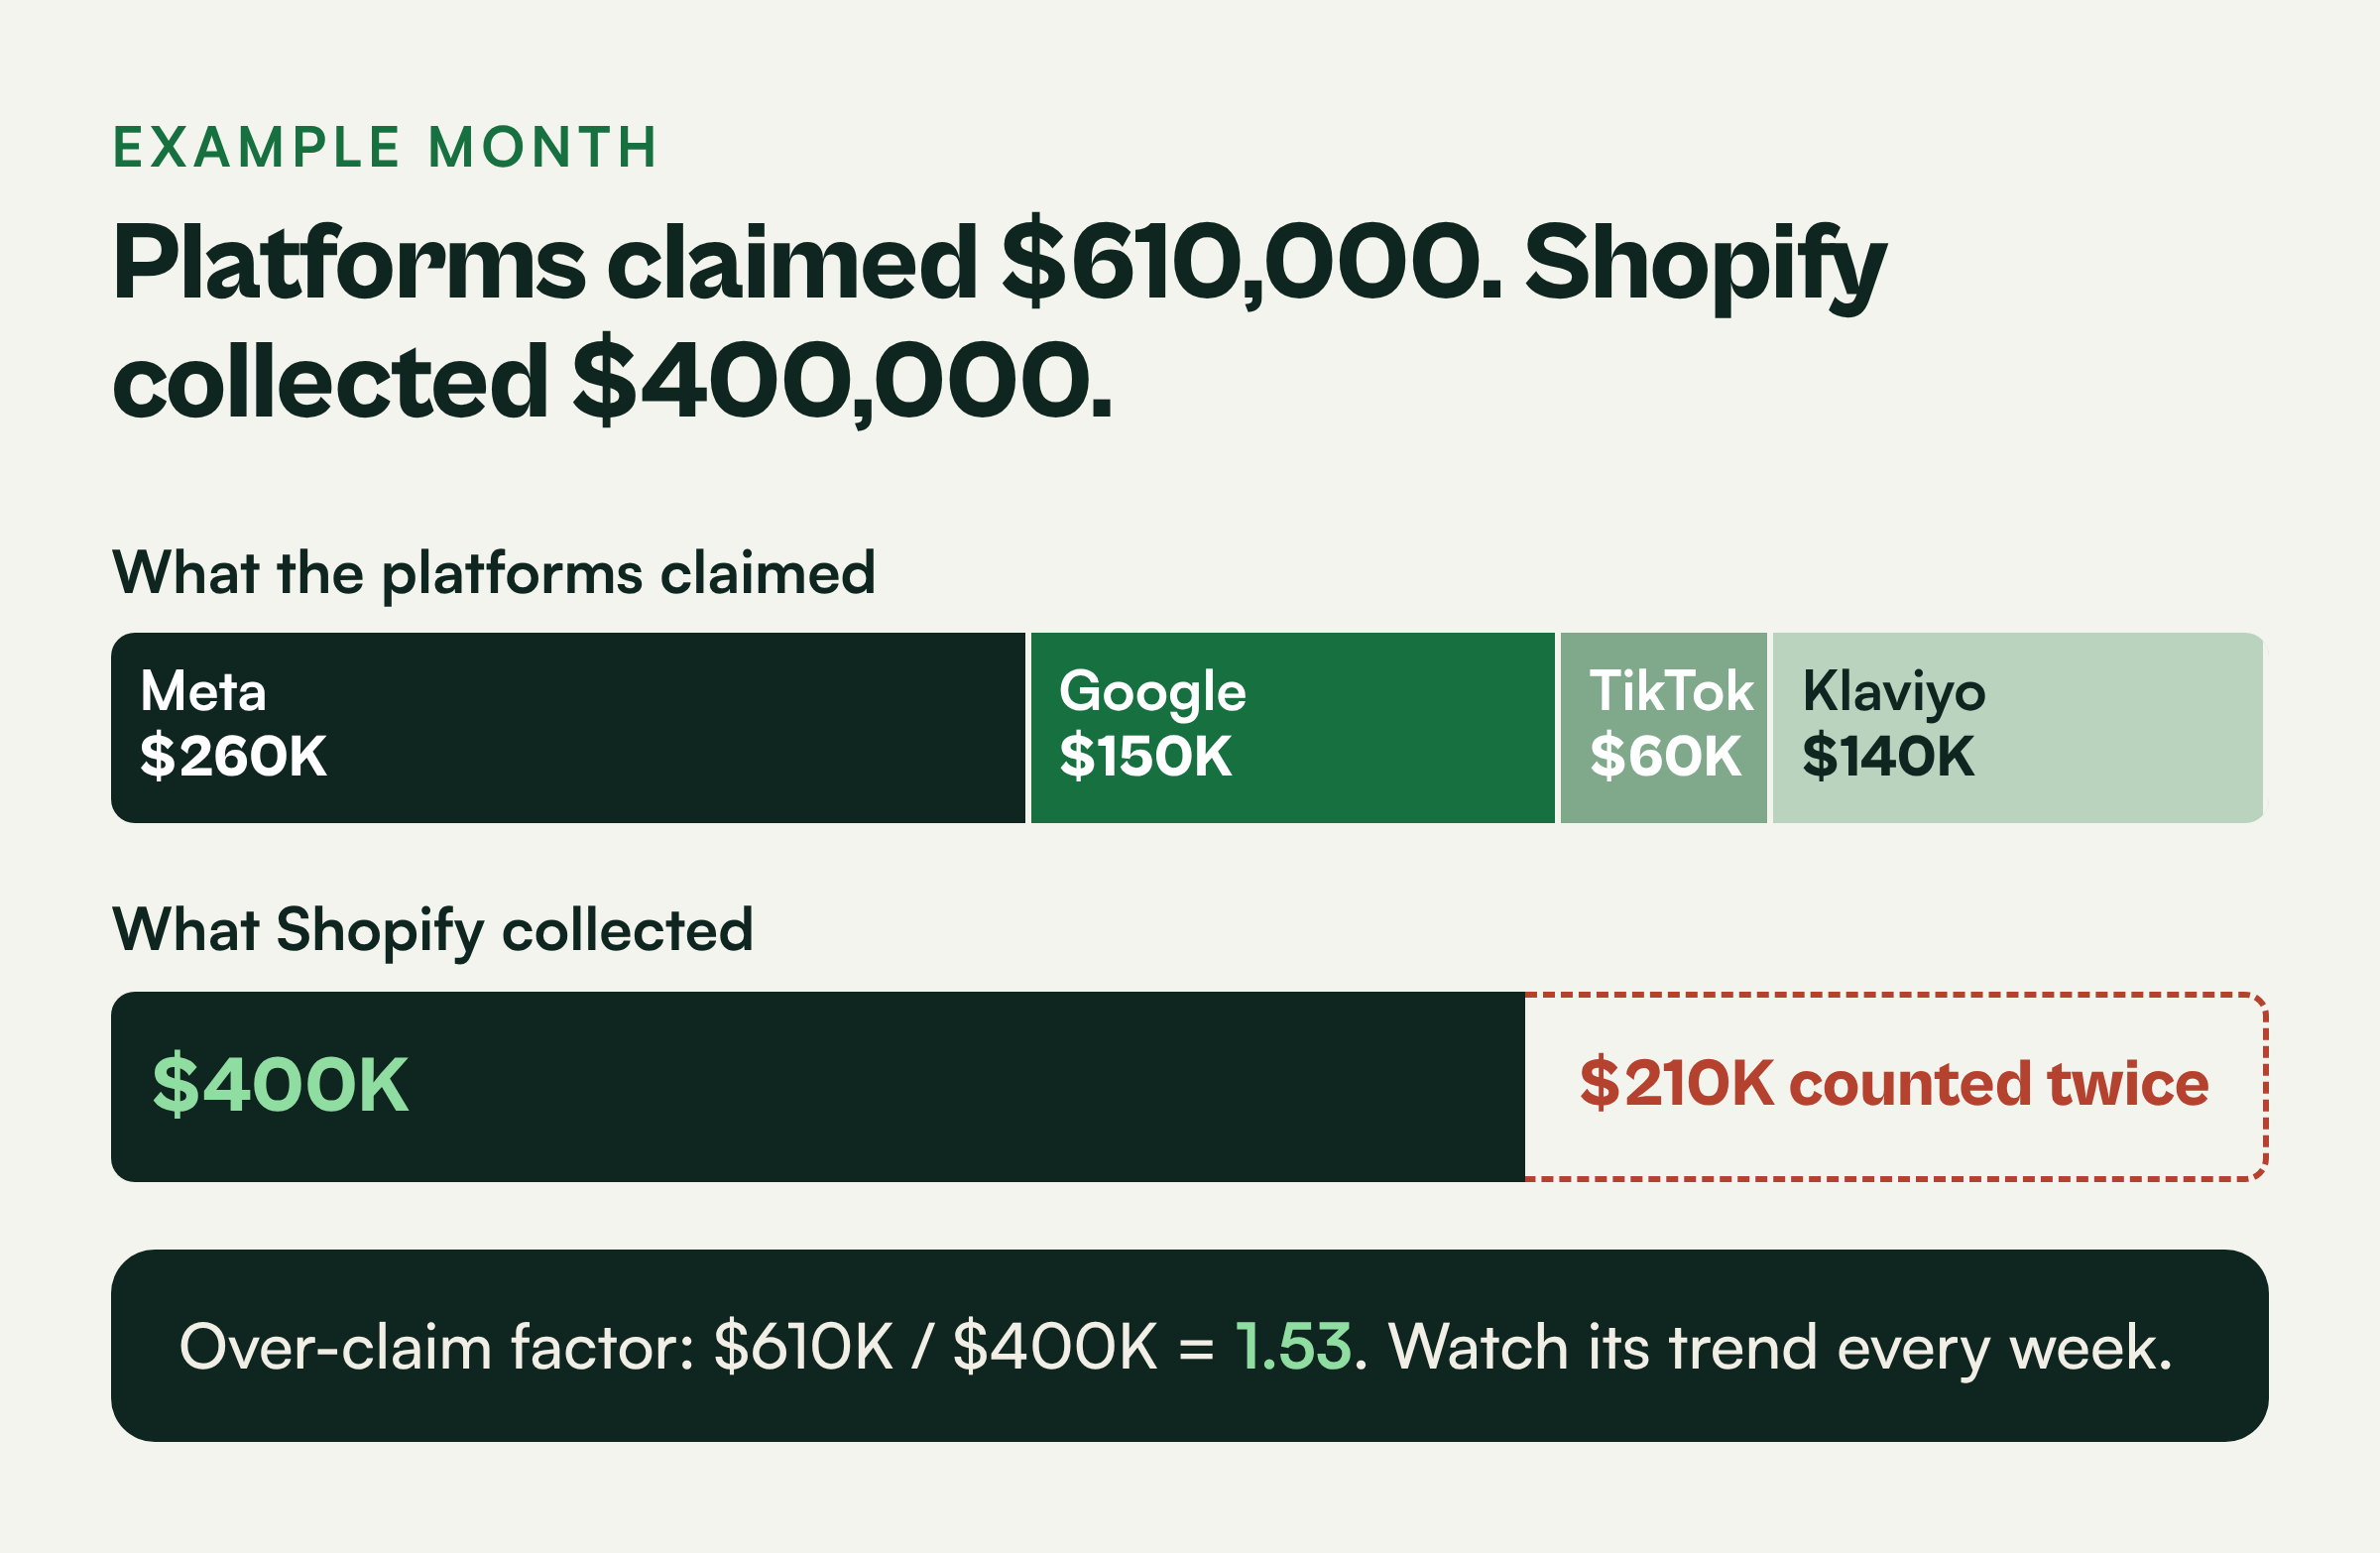
Here is an example month. These are example numbers for illustration:
- Shopify net revenue: $400,000
- Meta reported revenue: $260,000
- Google reported revenue: $150,000
- TikTok reported revenue: $60,000
- Klaviyo reported revenue: $140,000
- Total claimed: $610,000
That is $210,000 of credit for sales that happened once. Each platform grades its own homework with its own attribution window, and none of them knows your cost of goods, shipping or discounts.
The first step takes an afternoon. Export last month's Shopify orders, tag each one as new or returning, and divide total ad spend by new customers.
That single number usually tells you more than every ROAS column in your ad accounts combined. Over 15+ years and more than $500M in marketing spend managed, including 4 DTC brands taken from 4-6 figures to 7-9 figures, this map is what I build first. You can read more about that work on my about page.
Pick Shopify orders as your source of truth
Every report you open shows a different revenue number, and each one looks reasonable on its own.
The platforms disagree with each other and with Shopify. Worse, you can't tell whether your new-customer CAC makes or loses money on the first order.
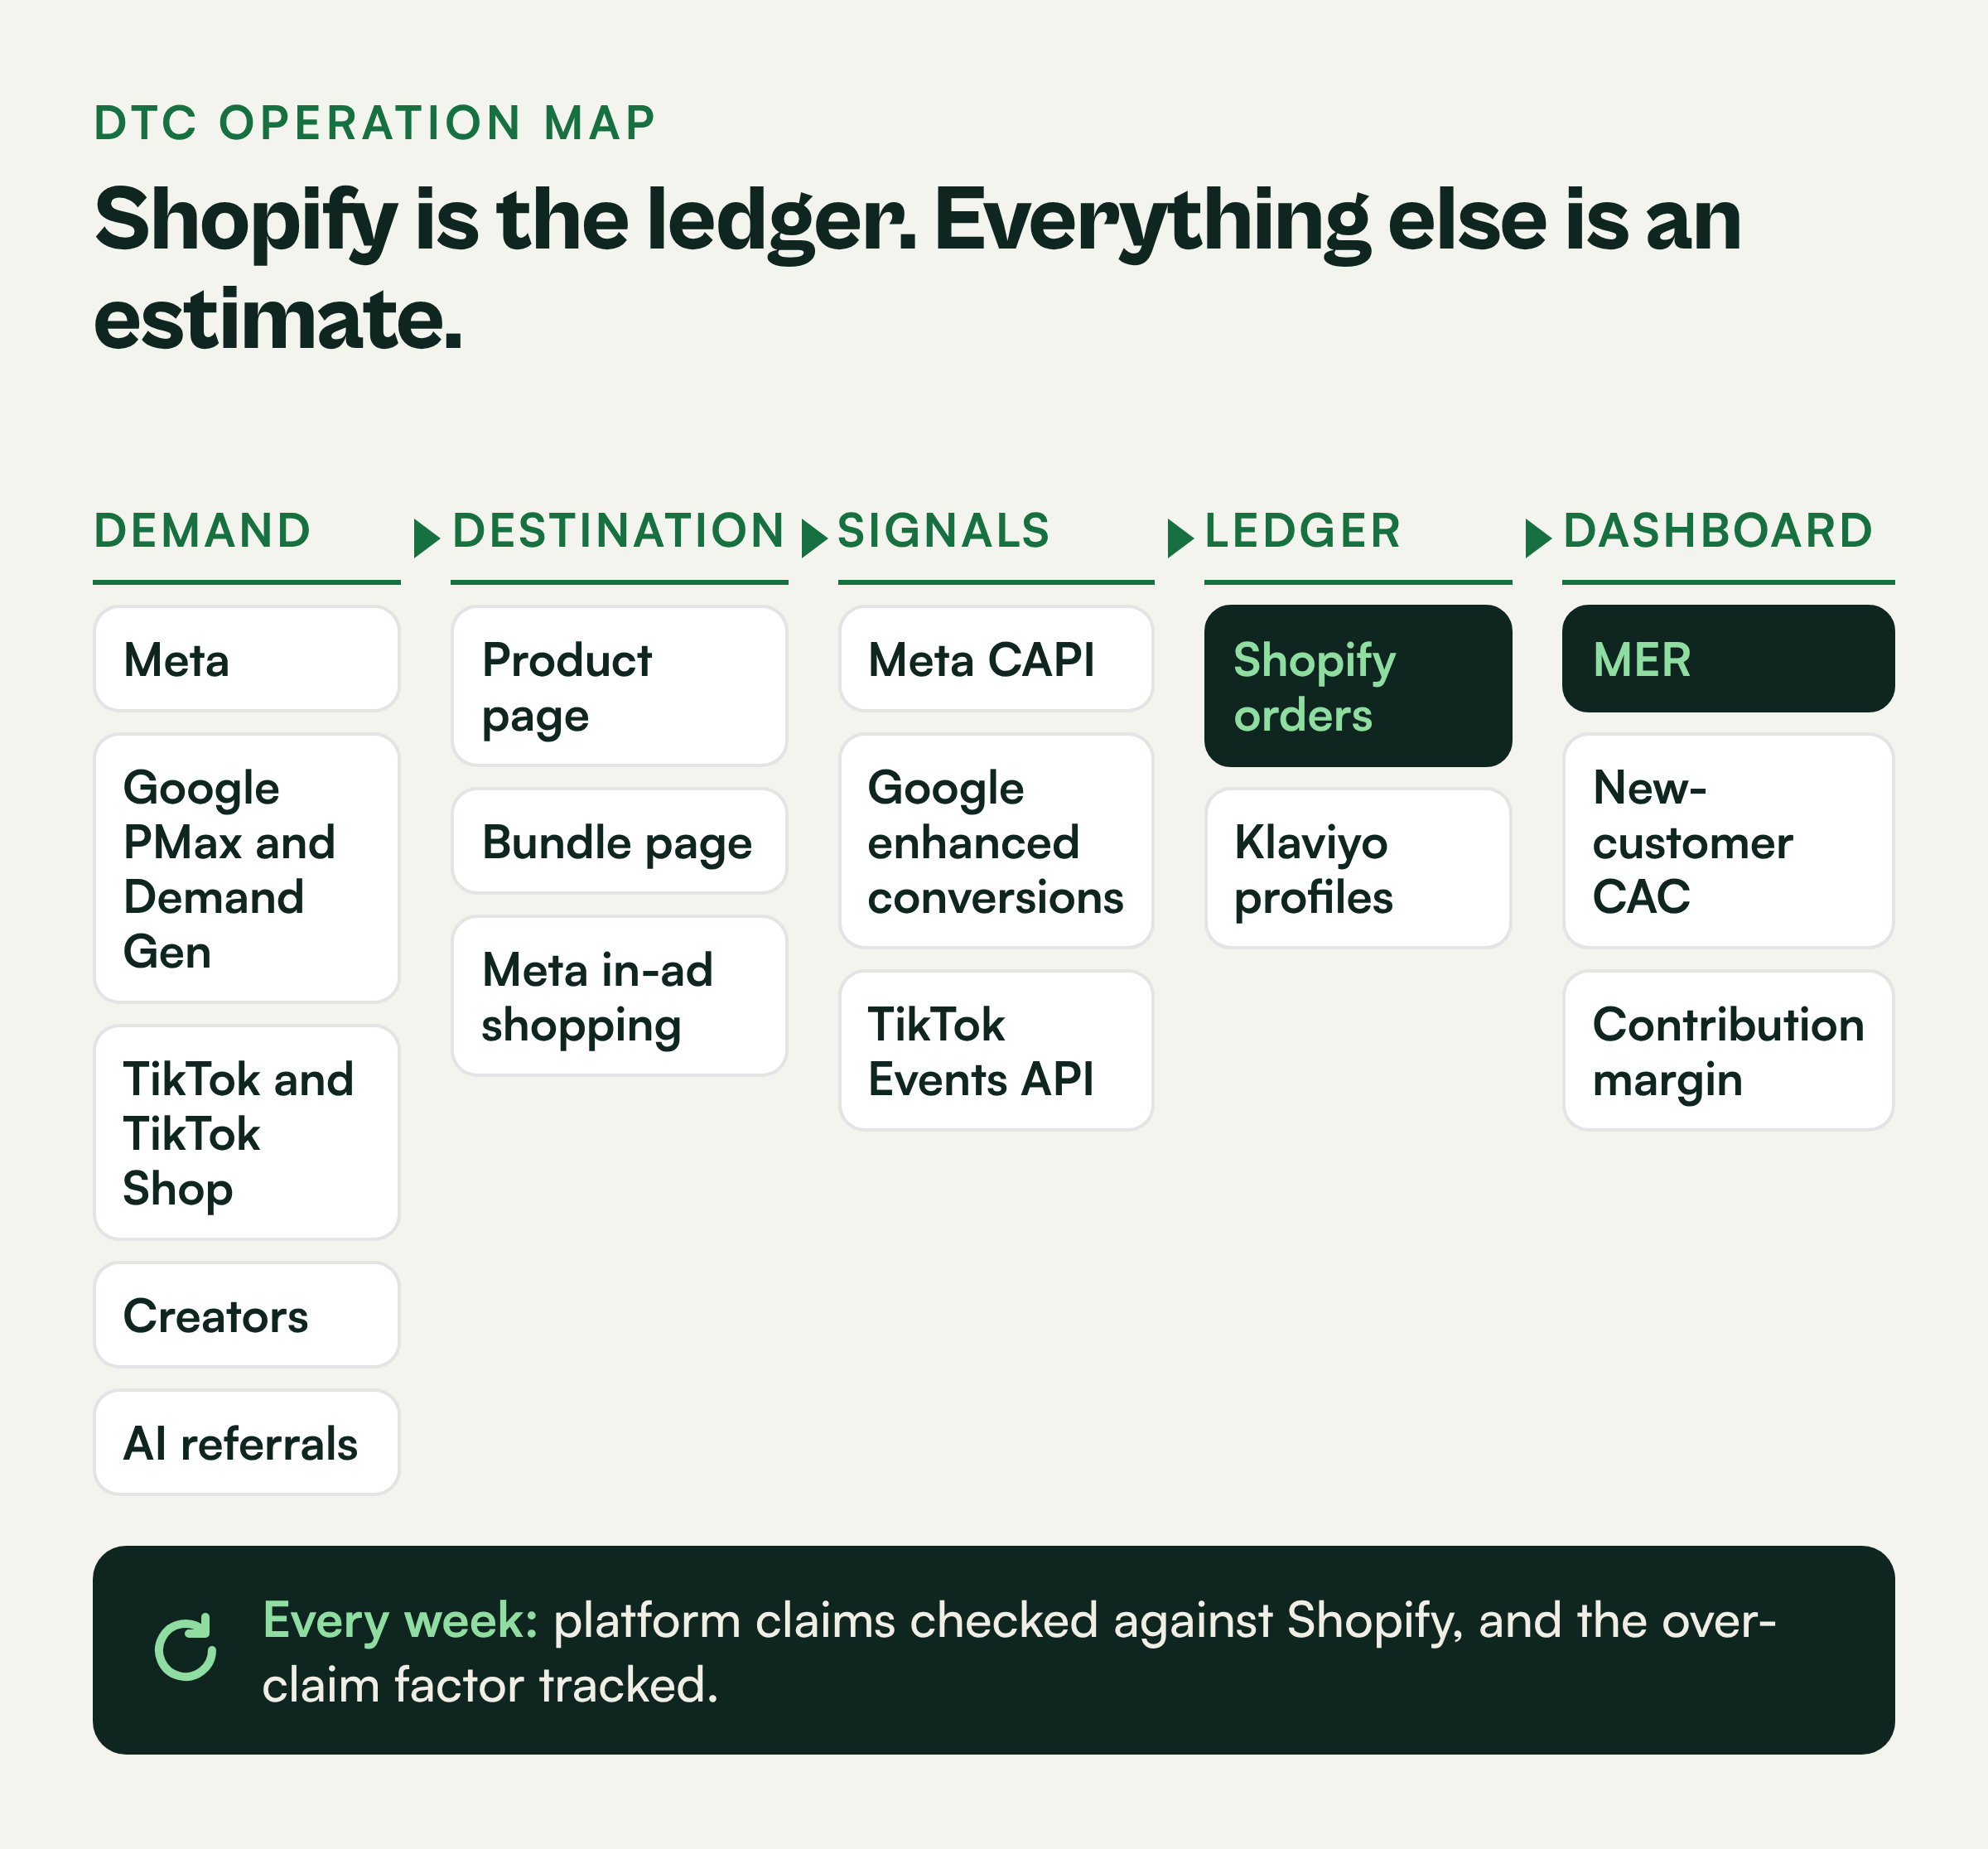
When the reports disagree, you need one number to trust. I make Shopify the ledger, and platform numbers become estimates you check against it.
Using the same example month:
- Total ad spend across all channels: $80,000
- MER: $400,000 / $80,000 = 5.0
- New customers: 1,600
- Blended new-customer CAC: $80,000 / 1,600 = $50
- Cost of goods at 35%: $140,000
- Shipping and fulfillment: $40,000
- Payment fees at 3%: $12,000
- Contribution after marketing: $400,000 minus $140,000 minus $40,000 minus $12,000 minus $80,000 = $128,000, or 32% of revenue
Now connect CAC to the first order. In this example, the average first order is $85 and first-order margin before ads is $46.
A $50 CAC means you lose $4 on the first purchase and need a second order to make money. That is fine if you know your 90-day repeat rate, and dangerous if you don't.
Set a maximum new-customer CAC from 90-day gross profit per customer. Every channel decision after this gets judged against that ceiling.
Give each demand channel one job
Your brand has Meta, Google, TikTok, creators and AI referrals all running at once.
That is where most wasted spend comes from: channels doing overlapping jobs.
The fix is to decide what each channel is responsible for and write down one role for each.
- Meta is your main prospecting engine for new customers. Judge it on how new-customer CAC in Shopify moves when you change Meta spend.
- Google Performance Max captures intent, but it will lean on brand searches and returning customers unless you exclude brand terms and turn on the new-customer acquisition goal.
- Google Demand Gen covers YouTube, Discover and Gmail placements. Treat it like Meta prospecting and hold it to the same CAC ceiling.
- Branded search is cheap defense. Keep it on, but never count it as growth.
- TikTok Shop is a separate storefront with its own fees, shipping and affiliate commissions. If you sync those orders into Shopify, tag them by sales channel so they stay separate.
- Creators cover paid seeding, whitelisted ads and affiliate commissions. Give each creator a unique link or code.
- AI referrals are shoppers arriving from ChatGPT, Perplexity, Gemini and Copilot. The volume is small for most brands today, but the intent tends to be high.
AI shopping is moving fast, and I covered how it changes peak season planning in Shopify agentic commerce for BFCM. For this map, the rule is simple: track it as its own channel from day one.
Send each click to a destination you chose on purpose
Click volume looks solid, and every campaign still lands wherever it was first set up to go.
Where a click lands changes CAC as much as the ad does. Platform defaults also change, and you may be opted into destinations and checkout options you never chose.
Each click needs a destination picked on purpose, and I pick it by audience and offer.
A product page fits shoppers who already know the product, such as branded search, retargeting and returning customers. It works when the decision is mostly made.
Cold Meta and Demand Gen traffic goes to a bundle landing page. A bundle page explains the problem, shows proof and raises order value.
Example math: if a bundle page lifts first-order value from $62 to $94 at the same $50 CAC, first-order margin before ads rises from roughly $34 to $52. The customer goes from unprofitable to profitable on order one.
Meta in-ad shopping can take impulse products under about $40, where fewer steps matter more than storytelling. Test it against your own pages before scaling.
Check your campaign settings for which destination and checkout options are turned on.
To test, split traffic by destination for two weeks and compare new-customer CAC in Shopify. Ignore which version the platform prefers.
Fix your signal quality before peak season
Campaign results are steady, and you're about to raise budgets for peak.
During peak, CPMs climb and every platform has less room for error. If your conversion signals are weak, the algorithm optimizes on thin data and buys cheaper, worse customers.
Before you spend more, each platform needs to see your real conversions. I tighten tracking on Meta, Google and TikTok, in that order, then check it against Shopify.
Start with Meta. Use the Conversions API through Shopify's Facebook and Instagram sales channel, set data sharing to the highest level, and confirm pixel and server events are deduplicated.
Then open Events Manager and check Event Match Quality on your Purchase event. Passing hashed email, phone and a customer ID usually raises it.
For Google, turn on enhanced conversions. Then set up Google Tag Gateway or server-side tagging so your tags load from your own domain and survive more browser blocking.
Review the data strength and diagnostics indicators Google shows for your tags. Fix any warning before you raise budgets.
For TikTok, set up the Events API alongside the pixel. Without it, TikTok's ads optimization runs on a fraction of your real conversions.
A quick test: compare platform-reported purchases to Shopify purchases for the same day. If Meta sees 60% of orders one week and 85% the next, something in your setup changed.
What each Shopify connection actually sends
Each ad platform gets its signal from its own Shopify app, and each one reports against its own copy of the order. That is why the totals overlap and why Shopify stays the ledger.
| Platform | Direct Google Ads connection? | How it sends conversions | What breaks it |
|---|---|---|---|
| Shopify to Google (Google & YouTube app) | Yes | Installs the Google tag. Enhanced conversions can be turned on in the app's Google Ads settings and add hashed first-party data. | Old Tag Manager or manual tags left running next to the app's tags. Enhanced conversions not also turned on in Google Ads. |
| Shopify to Meta (Facebook & Instagram channel) | Yes | At the Enhanced and Maximum data-sharing levels, the Conversions API sends purchases server to server, so browser ad blockers do not stop them. | Data sharing left at Standard, which uses the pixel alone. Pixel and server events not deduplicated. |
| Shopify to TikTok (TikTok app) | Yes | At the Enhanced and Maximum data-sharing levels, the app adds the Events API to the pixel. | Data sharing left at Standard. |
| Klaviyo | Audiences, not purchases | Its Google Ads integration syncs lists and segments to Customer Match audiences, matched on email and phone. | An account that does not qualify for Customer Match. Connecting through a manager (MCC) account, which is not supported. EEA and UK profiles without ad consent. |
Run Klaviyo and SMS as your customer record
Email and SMS show up as one of your biggest revenue sources.
That number deserves a closer look. Customer data sits in Shopify, TikTok Shop, quiz tools and review apps instead of one profile, and default windows can credit email for orders that ads or organic search drove. Apple Mail privacy features inflate opens on top of that.
To make Klaviyo your customer record and measure what it really adds, I sync every profile into it, segment on it, and measure lift with a holdout.
Sync Shopify, TikTok Shop where possible, quiz data and reviews so each profile shows first product, order count and channel of acquisition.
Build segments on that record: new versus returning, first product purchased and expected next order date. These segments also feed better audiences back into Meta and Google.
Shorten the attribution windows to click-based where you can. Then hold out 10% of your list from a major flow for a month and compare revenue per recipient.
Example math: if the flow group spends $4.10 per person and the holdout spends $3.20, the true lift is $0.90 per person. That is the number for your dashboard.
For timing, send in each recipient's local timezone and set SMS quiet hours. Federal rules generally limit marketing texts to 8 a.m. through 9 p.m. in the recipient's local time, and some states are stricter, so confirm your settings with counsel.
Score every creative and creator on one sheet
New ads and creator content go live every week.
Creative is now the biggest targeting lever on Meta and TikTok, yet budget calls still get made by arguing from memory.
Deciding which assets and creators deserve more budget takes one sheet, with every asset scored the same way.
Columns to track for each asset:
- Asset ID, creator and format
- Spend
- Hook rate: 3-second views divided by impressions
- Hold rate: 15-second views divided by 3-second views
- Click-through rate
- Platform CPA
- Share of purchases from new customers, where available
Example comparison: Asset A has a 38% hook rate, $6,000 spend and a $41 CPA. Asset B has a 22% hook rate, the same spend and a $58 CPA.
Asset A gets more budget and becomes the brief for the next five variations. Asset B gets cut or recut with a new opening.
Set a minimum spend before judging, such as two times your target CPA. Below that, you are reading noise.
For creators, total cost equals fee plus product plus commission. Divide that by orders from their link or code for a per-creator CPA you can compare against paid ads.
Build the margin dashboard
By now the channel roles, signals and creative scores are in place, each in its own tool.
No single view shows revenue, spend and margin together, and TikTok Shop margin changes fast in peak because of shipping and commissions.
I pull it into one weekly view, with one row per week and these columns:
- Total revenue from Shopify plus TikTok Shop
- Ad spend by channel
- MER
- New-customer revenue and returning-customer revenue
- New customers and new-customer CAC
- Contribution margin after marketing
- TikTok Shop net after fees and shipping
- AI referral sessions, orders and revenue
Give TikTok Shop its own margin line. Here is an example $50 order, with fee rates as examples only:
- Platform referral fee at 6%: $3.00
- Affiliate commission at 15%: $7.50
- Peak season shipping: $9.00
- Cost of goods at 35%: $17.50
- Net: $13.00, or 26% of the order
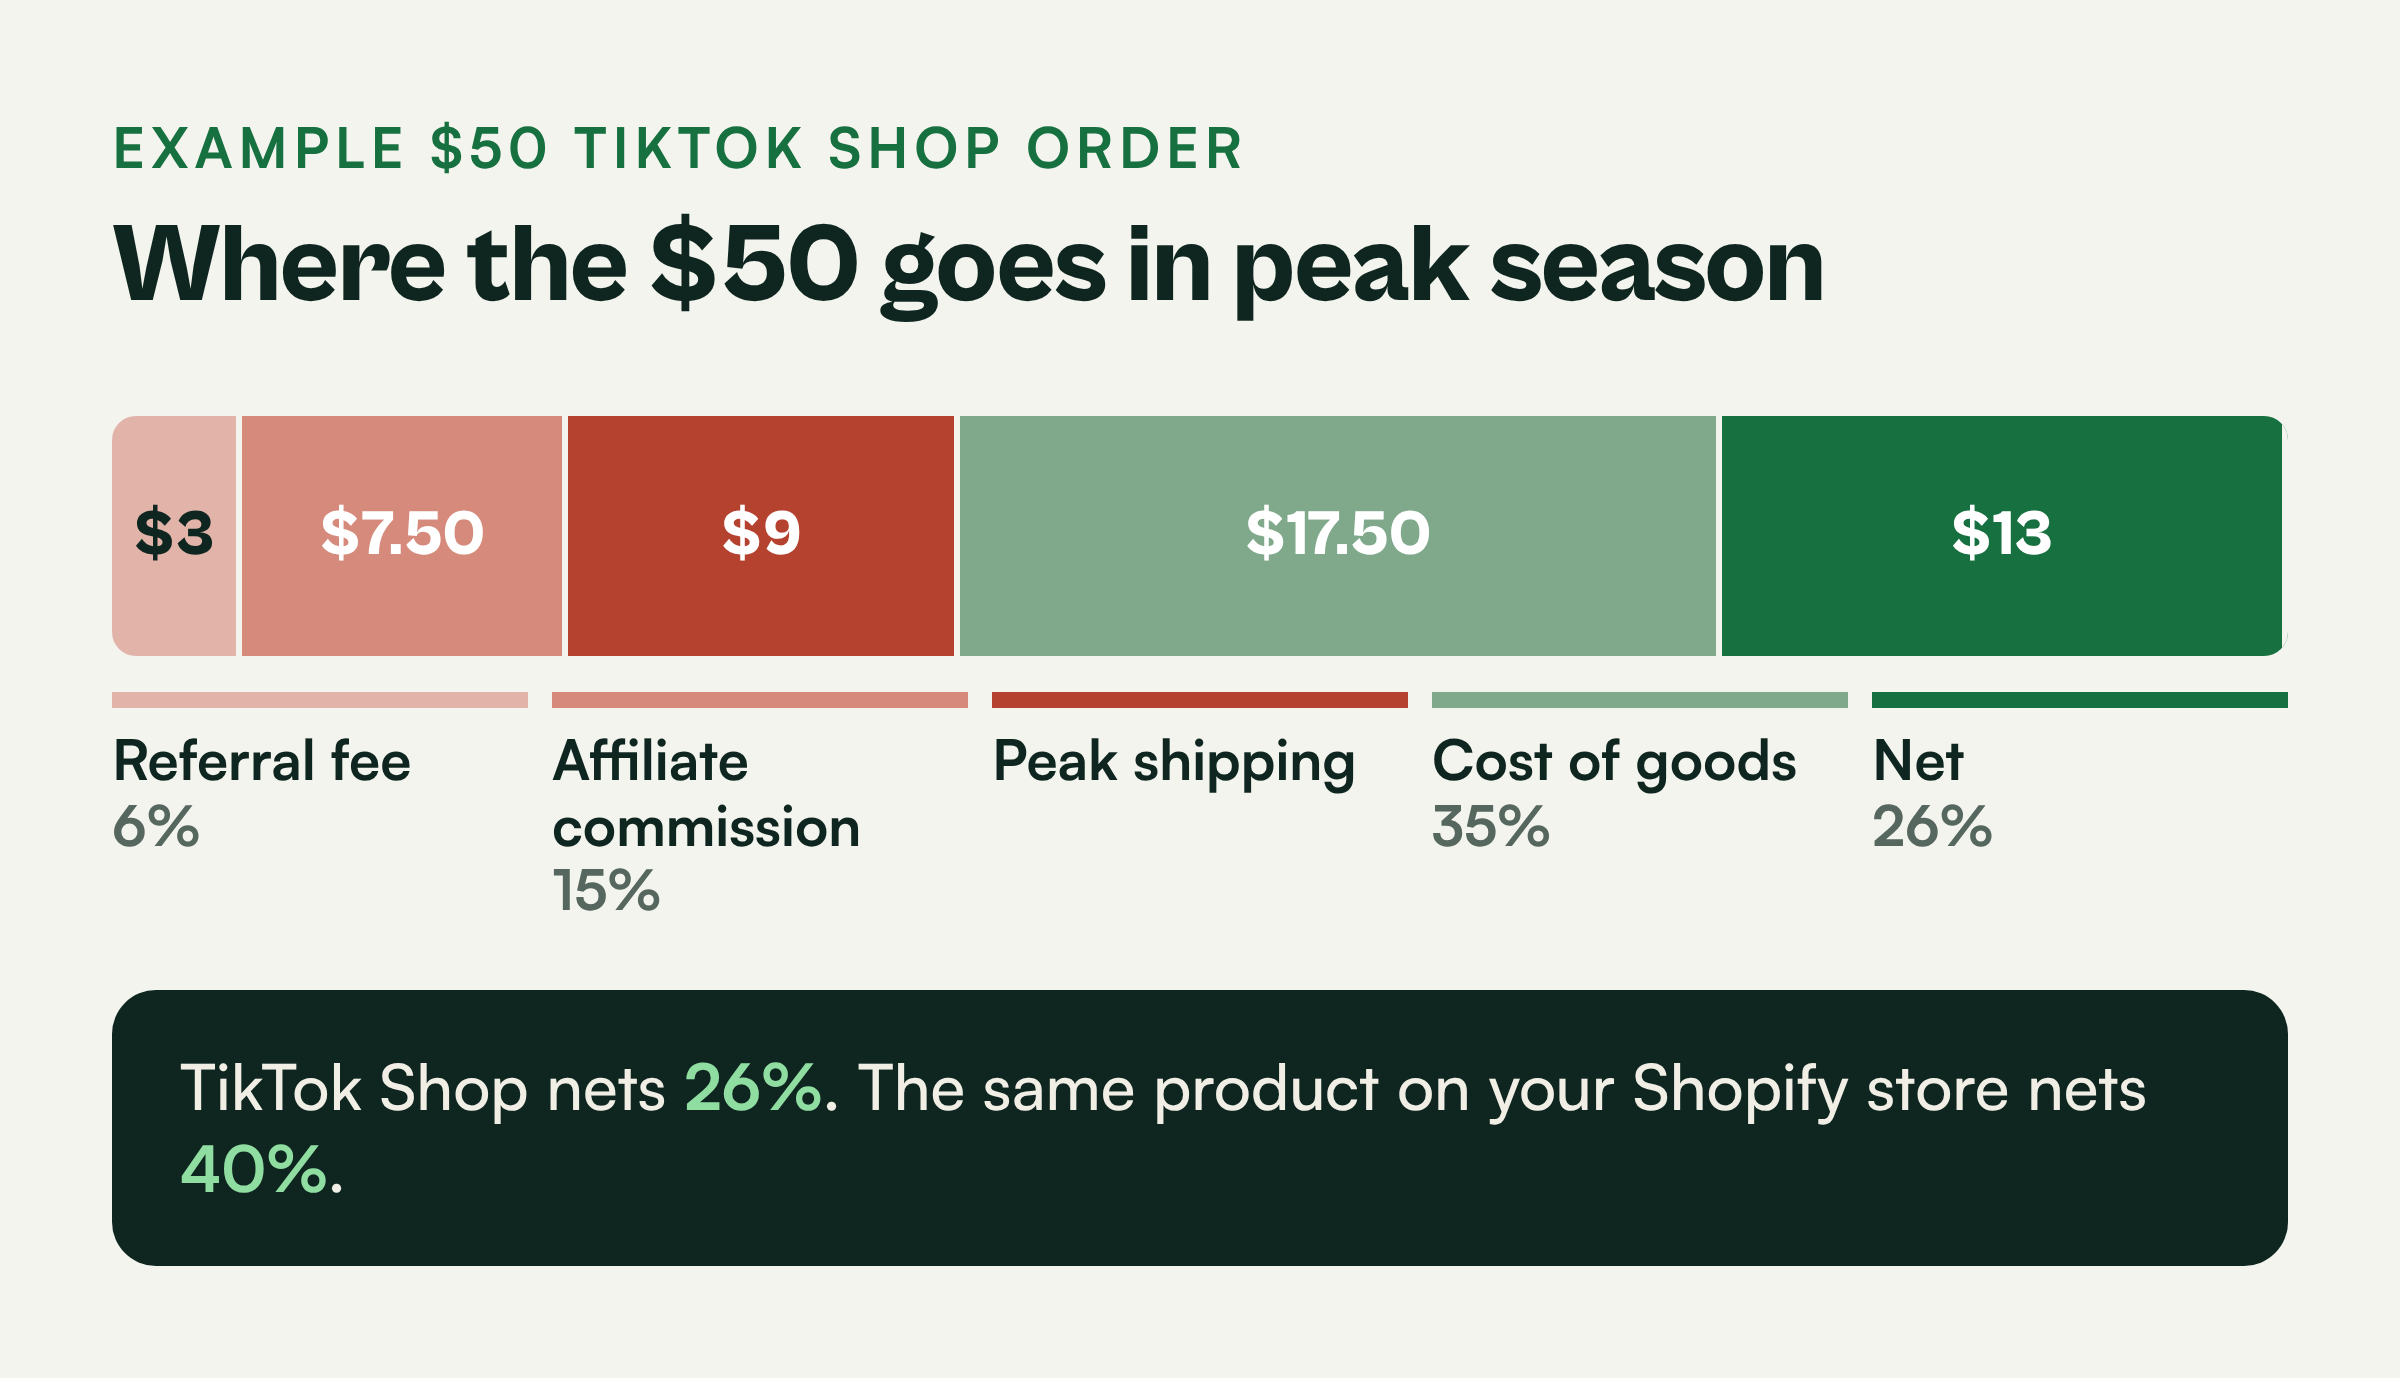
If the same product nets 40% on your Shopify store, TikTok Shop volume needs to be incremental to be worth it.
For AI referrals, filter sessions by referrer domains like chatgpt.com and perplexity.ai. Watch conversion rate and order value against your other channels.
Google Sheets or Looker Studio pulling from Shopify works for most brands. I use a version of this inside Marketing Impact OS, and you can see how DTC brands benchmark in the DTC brands report.
Reconcile platform claims against Shopify every week
Week after week, platform-reported revenue adds up to more than Shopify collected.
The gap can jump when an attribution window, event or integration changes. And platform reports can't tell you what each channel actually adds.
Keeping platform claims honest takes two habits: track an over-claim factor weekly, and test spend changes against Shopify. It is the same check I start every DTC audit with.
Divide total platform-reported revenue by Shopify revenue. In the example, $610,000 divided by $400,000 gives an over-claim factor of 1.53.
The exact number matters less than its trend. If it jumps from 1.5 to 2.1, check attribution windows, duplicate events or a new integration.
To learn what each channel actually adds, change spend and watch Shopify. Raise Meta 20% for two weeks and track new customers, or pause Google in a few regions and compare them to the rest.
A third-party attribution tool such as Triple Whale, Northbeam or Polar becomes worth paying for when you spend across three or more channels and conflicting reports are driving budget decisions. For many brands, that starts around $50,000 a month in ad spend.
Example payback math: a tool costing $1,000 a month that helps you move 5% of an $80,000 budget away from a weak channel frees $4,000. At a $50 CAC, that is 80 more new customers a month.
These tools still model the truth. Check their numbers against Shopify the same way you check Meta's.
Get your attribution map reviewed before peak
Peak season is close, and this map is partly built.
Before your biggest weeks, a second set of eyes on your channels, signals and dashboard is worth having.
Start with the free marketing assessment. I will review your channels, signals and dashboard against your Shopify numbers.
If you need someone to own the whole operation, here is how I work as a fractional CMO for DTC brands.
Questions owners ask
What is the best source of truth for DTC marketing attribution?
Shopify orders. Use them to calculate MER, new-customer CAC and contribution margin after ad spend, then treat each platform's reported numbers as estimates you reconcile against Shopify every week.
Why do Meta, Google and Klaviyo report more revenue than Shopify?
Each platform uses its own attribution window and counts any order it touched. When a customer sees a Meta ad, clicks a Google ad and opens an email, all three can claim the same order.
Should I set up server-side tracking before peak season?
Yes. Meta Conversions API, Google enhanced conversions with Tag Gateway or server-side tagging, and TikTok Events API give the algorithms more complete purchase data when CPMs are highest and mistakes cost the most.
How should I track AI referrals from ChatGPT and Perplexity?
Treat them as their own channel. Filter sessions by referrer domains such as chatgpt.com and perplexity.ai, then track orders, conversion rate and order value separately in your margin dashboard.
When is a third-party attribution tool worth the cost?
Usually once you spend across three or more channels and conflicting reports are affecting budget decisions, often around $50,000 a month in ad spend. Check its outputs against Shopify, since it still models results.